Australia's Neighbours |

|
|
Data concept:
Band:
Suggested year level:
Relevant content description:
|
Collecting, managing and analysing data
3-4
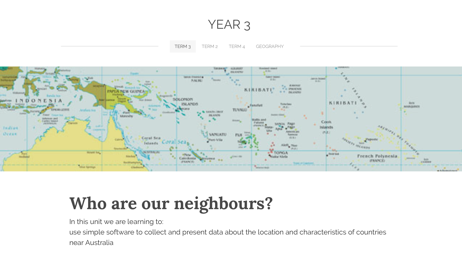
Year 3
Collect, access and present different types of data using simple software to create information and solve problems (ACTDIP009)
|
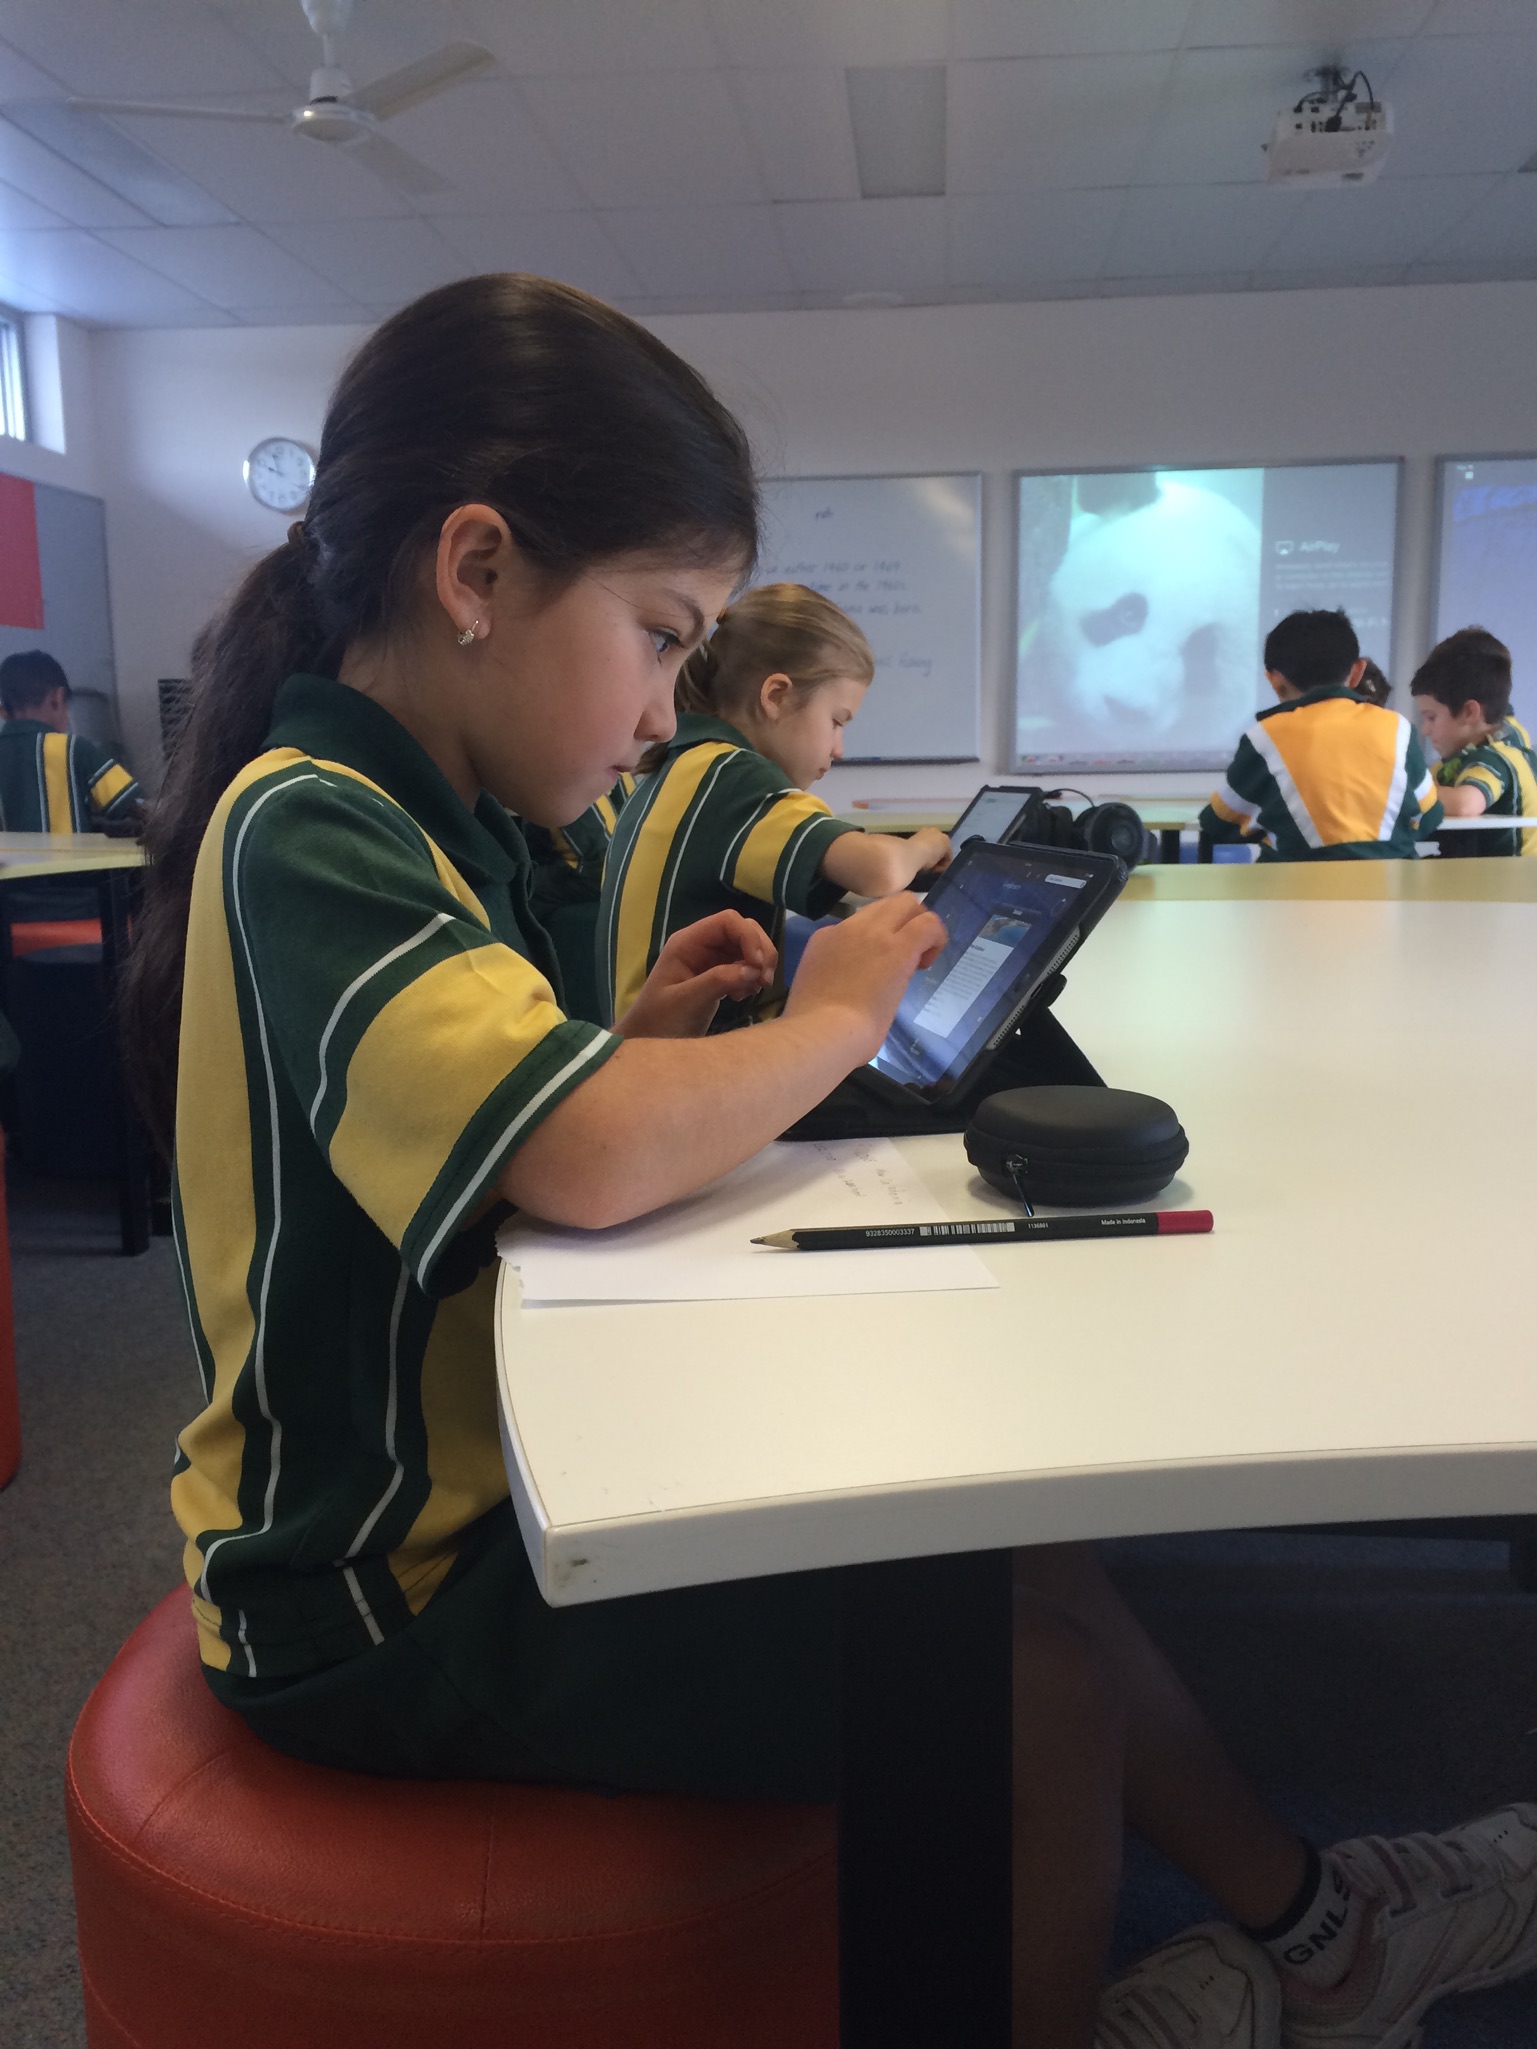
To tie in with a Geography study on Australia's neighbouring countries, the Year 3 students collected data and created simple data displays using different software, including Google Earth and Numbers. Students were introduced to basic spreadsheet skills as they accessed different types of data about countries near Australia.
The webpage linked here is designed for classroom use. It contains links to resources for students.
Lesson 1
In the first lesson, students are introduced to Google Earth and learn to search for different places, to zoom in and out and to find further data about the places. They search for a number of cities within the Asia Pacific region and by recognising the different mapping conventions, the determine the countries these cities are in. They determine the location of each place relative to Australia (or the city in which they live).
In the first lesson, students are introduced to Google Earth and learn to search for different places, to zoom in and out and to find further data about the places. They search for a number of cities within the Asia Pacific region and by recognising the different mapping conventions, the determine the countries these cities are in. They determine the location of each place relative to Australia (or the city in which they live).
Lesson 2
In Lesson 2, students are introduced to the Numbers spreadsheet app as they explore data about the climate of particular cities in the Asia Pacific region. They firstly look at the data in a table, and then create a chart for each city using the spreadsheet. As the purpose of the lesson is about understanding the data and how to create a graph, and not on data entry skills or table formatting, the students are provided with a pre-populated spreadsheet (available via a link on the Australia's Neighbours website). The students are encouraged to look for patterns in the data to compare the climates in different cities.
In Lesson 2, students are introduced to the Numbers spreadsheet app as they explore data about the climate of particular cities in the Asia Pacific region. They firstly look at the data in a table, and then create a chart for each city using the spreadsheet. As the purpose of the lesson is about understanding the data and how to create a graph, and not on data entry skills or table formatting, the students are provided with a pre-populated spreadsheet (available via a link on the Australia's Neighbours website). The students are encouraged to look for patterns in the data to compare the climates in different cities.
|
This lesson supports students' learning about data displays in Mathematics.
|
Interpret and compare data displays (ACMSP070) |
|
Lesson 3
Students use their searching skills in Google Earth to collect data about mountain heights in different countries. They record the data they collect in a spreadsheet and create a chart to display the data. It is important for students to understand that the spreadsheet requires only numbers to be entered in a field in order to be able to create a chart. This helps them to build their understanding of data representation, and is necessary for the activity to work. They are introduced to new chart formatting skills, including adding titles and labels, that will enhance their data displays. This lesson supports students' learning about data displays in Mathematics.
Collect data, organise into categories and create displays using lists, tables, picture graphs and simple column graphs, with and without the use of digital technologies (ACMSP069) |
Lesson 4
To showcase their learning through this lesson series, students complete a task that requires them to collect different types of data about Australia's Neighbours from Google Earth and to enter the data into a spreadsheet. They create a short video description to show their understanding and skills.
To showcase their learning through this lesson series, students complete a task that requires them to collect different types of data about Australia's Neighbours from Google Earth and to enter the data into a spreadsheet. They create a short video description to show their understanding and skills.
