Picture Graphs |

|

|
Data concept:
Band:
Suggested year level:
Relevant content description:
|
Collecting, managing and analysing data
F-2
Year 2
|
I came up with this activity to create picture graphs using Explain Everything when the Year 2 teachers were trying to teach and assess the Data representation and interpretation concepts in Mathematics. Not being able to find a simple, cost efficient app to create picture graphs, we decided to scaffold the creation of the graphs by sharing a set of images via a website, and then helping the students to build their graph in Explain Everything.
|
To introduce the concept and skills of creating a picture graph using the iPad, the students were guided through the process using data provided by the teachers. The students were shown how to collect and save the images they needed for their picture graph and how to insert these images into Explain Everything to create the graph. Advanced skills such as locking the grid image in place, and duplicating the images of each topping the desired number of times were demonstrated to make the process more manageable. Creating the graph horizontally worked best for the orientation of the screen, and also for allowing the category labels to be included more easily.
|
|
Identify a question of interest based on one categorical variable. Gather data relevant to the question (ACMSP048)
|
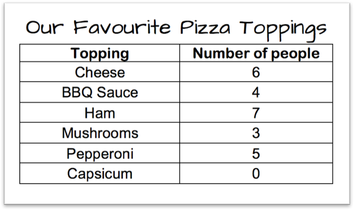
To assist children in identifying a suitable question, a variety of images were presented to the students. Students brainstormed possible questions that could result in the given categories, e.g. favourite colour, favourite fruit, favourite sport, favourite school subject etc. The students then created their own question based on a set of images and developed a data collection table using between 4 and 7 images. The students then surveyed their classmates and recorded their data using tally marks in their table.
|

|
Collect, check and classify data (ACMSP049)
The tally marks were counted to determine the item with the largest number of responses. Using this number, and the number of categories, they selected the most appropriate grid image from the website. Students were challenged to think critically about the number of grid spaces they would need to show their data most effectively.

|

|

|

|
Create displays of data using lists, table and picture graphs and interpret them (ACMSP050)
|
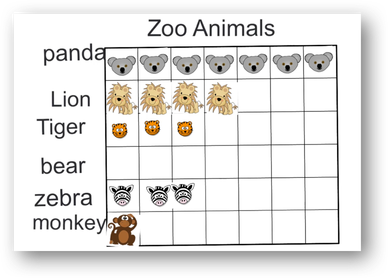
The data from the students' tables and the images from the website were used to create picture graphs. Students were encouraged to give their graph appropriate labels and a title, and some students added numbers along the gridlines.
Once the picture graph was complete, students were able to record their interpretation of the graph orally using the voice recording facility in Explain Everything. |
|
The images provided to the students are available on the Picture Graph website. They are a combination of images that I created myself and public domain images found on Pixabay.
