Food Fact Finder |

|
|
Data concept:
Band:
Suggested year level:
Relevant content description:
|
Defining problems in terms of data
5-6
Year 5
Define problems in terms of data and functional requirements drawing on previously solved problems (ACTDIP017)
|
This teaching idea could be linked to a study about food and nutrition in Health and Physical Education. As students investigate claims made on packaging about the nutritional benefit of foods, they consider how they might develop a digital solution to make it easier for consumers to quickly weigh up decisions about different options.
The ideas in this sequence are organised using the 5Es inquiry model - Engage, Explore, Explain, Elaborate, Evaluate.
The ideas in this sequence are organised using the 5Es inquiry model - Engage, Explore, Explain, Elaborate, Evaluate.
Engage
The need to be critical in our thinking about claims made by advertisers and on food packaging about the "health benefits" of packaged food can be highlighted through visualisations and demonstrations.
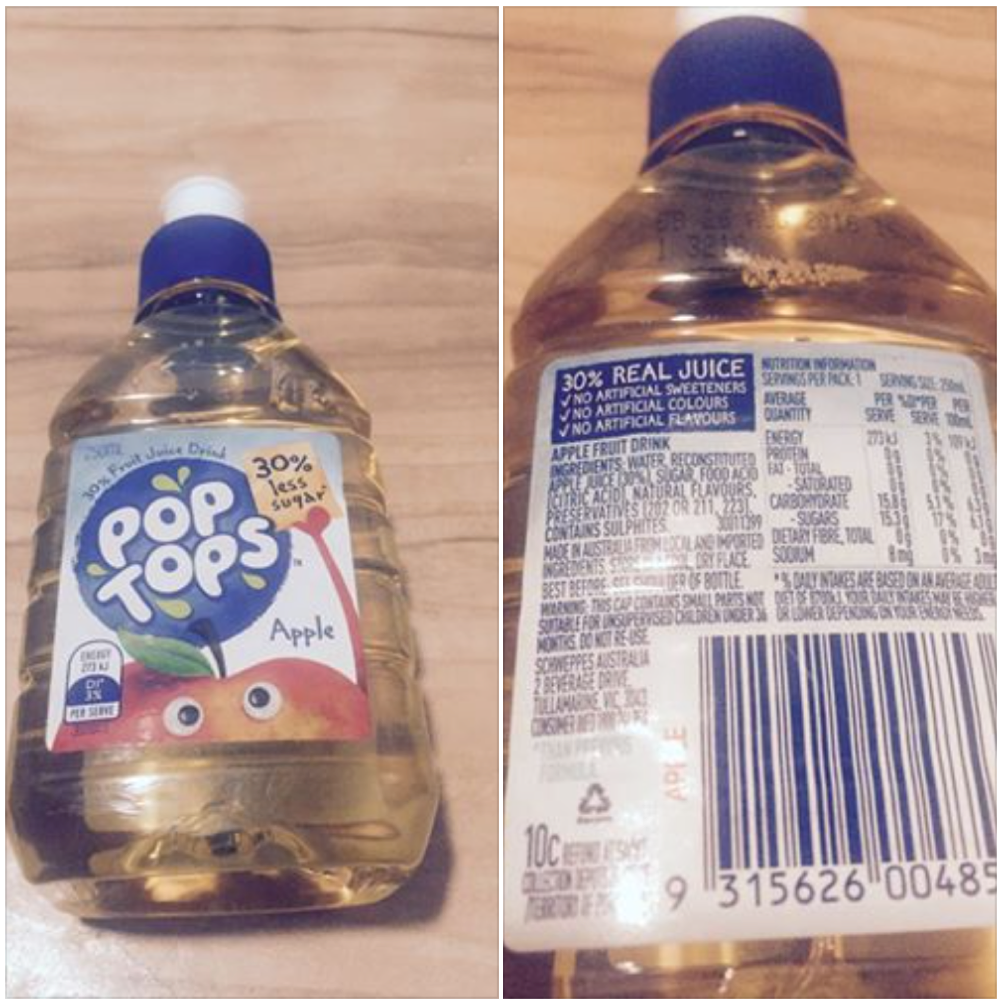
The teacher could bring in some samples of food packaging with questionable claims for investigation by students, or students might be asked to bring in an example from home. Many food packages have bold claims such as "Low in Sugar" or "50% less fat" or "made from natural ingredients".
A list of claims could be compiled by students using a tool such as AnswerGarden so that students can see which claims are commonly made, and what similarities there are in wording on different packages. Aside from the text, students could also consider the images and colours used that might also be designed to persuade consumers that the product is "healthy".
|
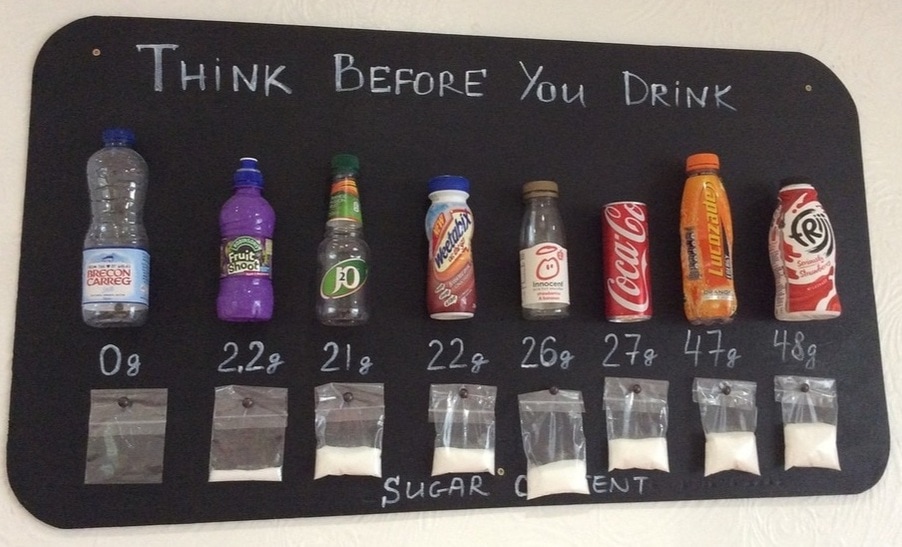
Taken from a Facebook post by The Root Cause: |
|
Another great way to visualise the amount of sugar in different drinks commonly consumed by children, is to measure out the amount of sugar contained in the drinks. This data could be displayed visually and displayed within the school or a short summary could be shared on the school Facebook page or on a class blog.
A similar activity could be done for salt or fat content. |
|
Explore
Learning more about the claims
Students will need to do some investigation into the different terms used, what these terms can mean, and how manufacturers and advertisers can use these claims to persuade consumers that their products are healthy.
The following are links to some websites and articles that discuss this issue, although there are many more examples available.
|
Although this is a US based website, the visuals and simple explanations should be easy for most students to understand. Students could find similar Australian products and determine if the same claims are made by these companies. The 5 point summary towards the bottom of the page is useful.
|
This article is useful for students, particularly in introducing the idea that there are organisations such as Choice that provide consumers with generally trustworthy and credible information about a range of products. It also an Australian website, so it relevant to our students.
|
Another US resource, this PDF contains ideas for parents to help children understand food labelling. Many of the ideas could be adapted for use in the classroom, or shared with parents to let them know how they can support the learning happening at school.
|
Looking at products
Students should be encouraged to assess the claims made by companies by looking closely at the nutrition panels and looking up terms and ingredients in an online database or dictionary.
As a class, determine the types of data about each product that might need to be recorded (e.g. product name, company, sugar per 100g, fat content, fibre, health claims, etc.) As they investigate different foods, they could add to a collaborative class database (using Airtable) or spreadsheet (using Google sheets).
What is being done about it?
The issue of misleading food labels is not a new one, and there have been many attempts to address this issue. One initiative was the Health Star Rating scheme described in a 2014 BTN episode about food labelling. Students could consider why this initiative was not successful and what opposition there might have been, particularly from manufacturers who did not want to pay to redesign their packaging. A labelling system like this might also be difficult as a lot of products are produced overseas. The simplicity of the 5-star rating also makes it difficult to know more specific details such as whether it is fat, sugar, fibre or something else that is being considered to give the overall rating.
Students might be encouraged to think of alternatives. How could we use digital technologies to develop a solution?
Explain
Identifying the data
Students summarise the learning from the "Explore" phase and identifying the types of data that we need to know in order to make healthy food choices. They could try to cluster or organise the types of data that would be required into categories, or rank the types of data in order of concern for health. Discussions about different ways of organising and ranking will help students realise there is more than one
Students summarise the learning from the "Explore" phase and identifying the types of data that we need to know in order to make healthy food choices. They could try to cluster or organise the types of data that would be required into categories, or rank the types of data in order of concern for health. Discussions about different ways of organising and ranking will help students realise there is more than one
|
Connection circles
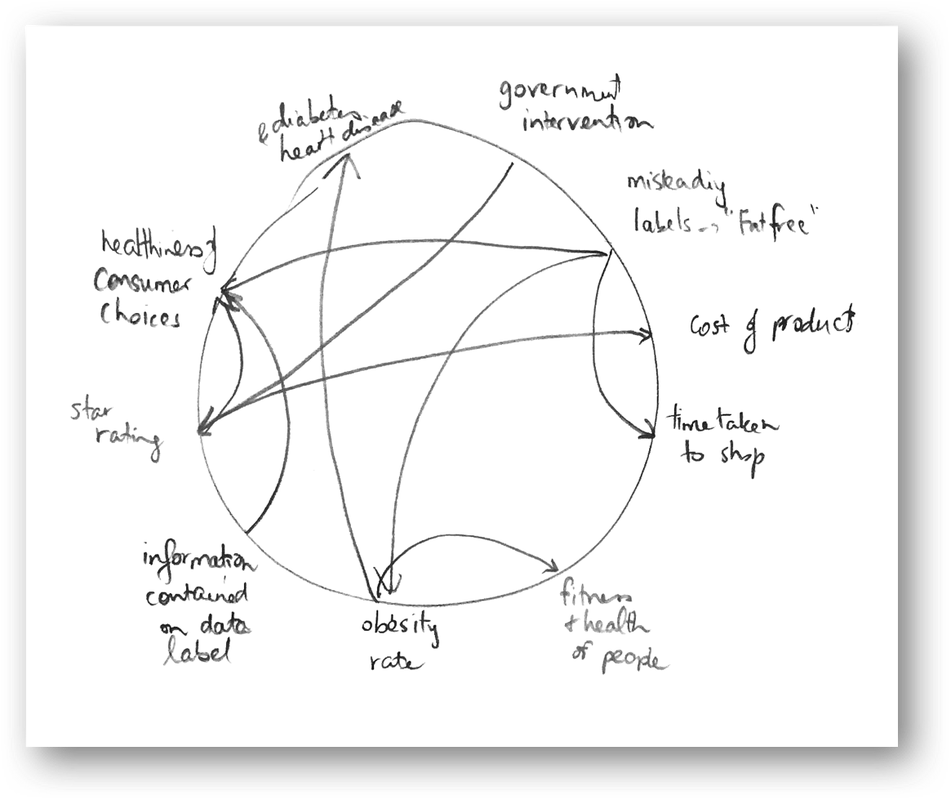
Systems thinking is one of the key ideas of the Technologies learning area. It is important for students to develop an understanding of the interconnected nature of a system in order to identify problems and to develop effective solutions. A connection circle is a useful way of understanding how the parts of a system might impact on one another. They can be used to identify causal loops and to inspire possible solutions to a problem through a deeper understanding of what is happening. Students could review the BTN episode, or use another similar situation to create a connection circle diagram, working with a small group. Around the outside of the diagram, stocks (things that can change over time) are written. Arrows are drawn to show relationships between these stocks, e.g. misleading labels causes obesity to increase; increased obesity leads to increased risk of diabetes and heart disease. The discussion within the group about the relationship between different factors in the system, as well as comparison of different group solutions will lead to deeper understanding of the issue. |
|
Elaborate
Designing a solution
Working in a team of two or three, students collaboratively design an interface for an app that might help consumers in making healthier decisions when purchasing packaged items. They should consider how the app would work (e.g. scanning a barcode, then the app accesses an online database about the food products; or entering a nutritional element or food additive code and then locating relevant information and explaining this simply to the consumer).
The students create a promo for their proposed solution using presentation software such as Keynote, iMovie trailer or Explain Everything. Within their presentation, they must define the data that would be included in their app (i.e. explain what it will tell consumers), as well as describe the functionality of their proposed solution (i.e. explain how it works).
Evaluate
The groups share their promo presentations with the class. Students use a simple feedback tool such as "two stars and a wish" to give feedback to each group. This feedback is also gathered so that the class can synthesise a class solution to the problem that combines aspects of individual group solutions.
As a class, consider what would a good solution look like? What features would it have? What data would need to be included?
Alternatively, the groups can use the feedback to further refine their ideas and improve their original solution and presentation.
The refined ideas should be shared to a wider audience, such as inviting parents or another class to view their refined presentations, or publishing a blogpost that explains the problem the class was trying to address, and their solution.
