What a load of rubbish! |

|
|
Data concept:
Band:
Suggested year level:
Relevant content description:
|
Data representation
3-4
Year 4
Recognise different types of data and explore how the same data can be represented in different ways (ACTDIK008)
|
To tie in with a Geography study on issues surrounding sustainable management of waste, students collected data about litter in the schoolyard. The Data Project: Clean School work sample provided by ACARA shows the results of a similar idea and would be useful in making judgments about student progress in Digital Technologies.
The learning and assessment focus for this Digital Technologies task is around Data Representation, but students would also be developing skills around data collection and analysis, so this may also provide opportunities for students to demonstrate the skills described in ACTDIP009.
The learning and assessment focus for this Digital Technologies task is around Data Representation, but students would also be developing skills around data collection and analysis, so this may also provide opportunities for students to demonstrate the skills described in ACTDIP009.
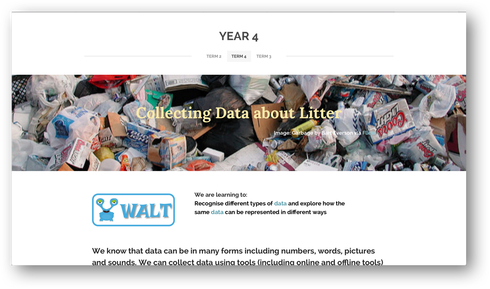
The webpage linked here is designed for classroom use. It contains links to resources for students.
Lesson 1
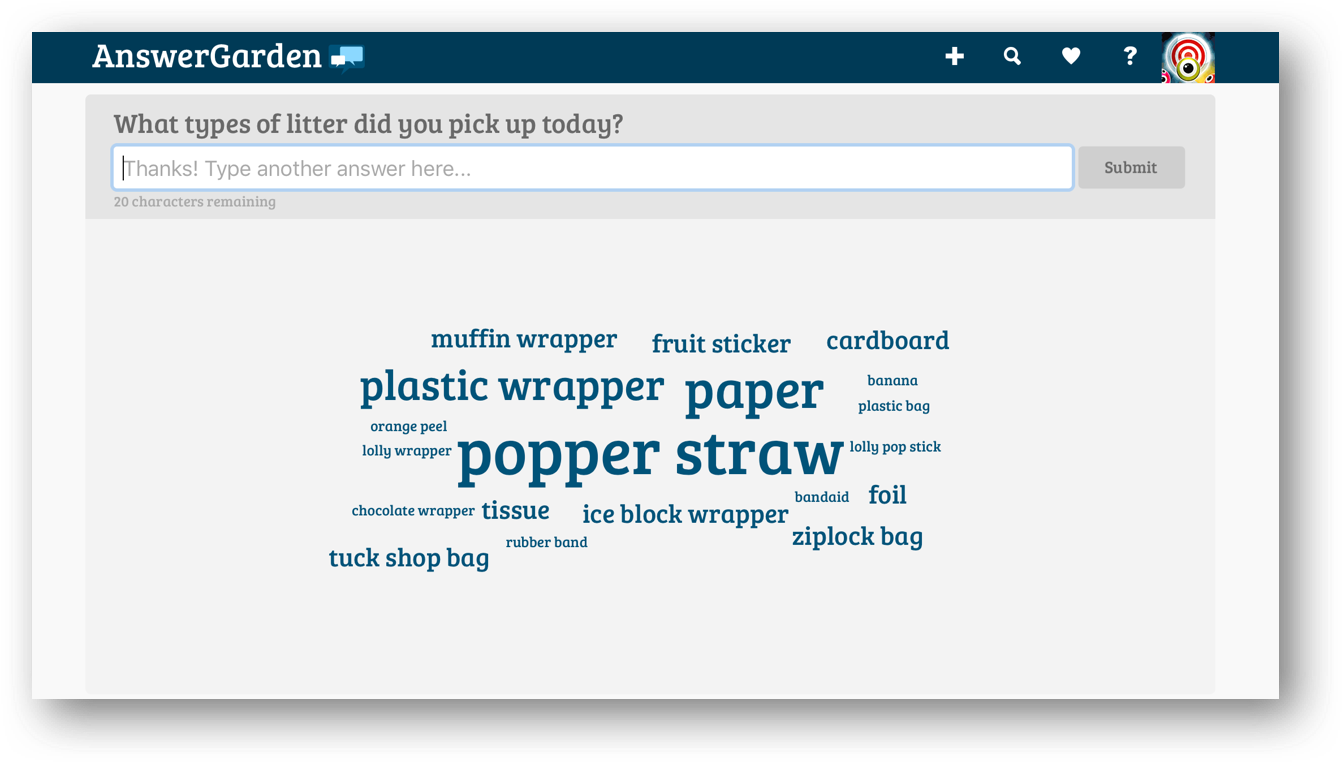
In the first lesson, students review concepts about data representation and what data is. They bring along a piece (or more) of litter that they have collected in the playground. In the first activity, the students use an Answer Garden to record the types of litter they have collected that day. They observe how the Answer Garden displays the data and what information can be gleaned from this word cloud. For example, different colours denote that it is an answer they have given, the size of the word denotes how common an answer is and by hovering over an answer, they can see how many times that response has been given. They also notice the importance of validating data as misspellings are not gathered with the intended response.
They then work in a group of about 6 students to sort and categorise the litter they have collected in different ways. They brainstorm questions they might have about litter and consider which questions could be answered through data collection.
|
Example student questions:
|
Using a spreadsheet to deal with data
Students used data from the Clean Up Australia Rubbish Report to review basic spreadsheeting skills such as creating charts and they explored formatting options.
Students used data from the Clean Up Australia Rubbish Report to review basic spreadsheeting skills such as creating charts and they explored formatting options.
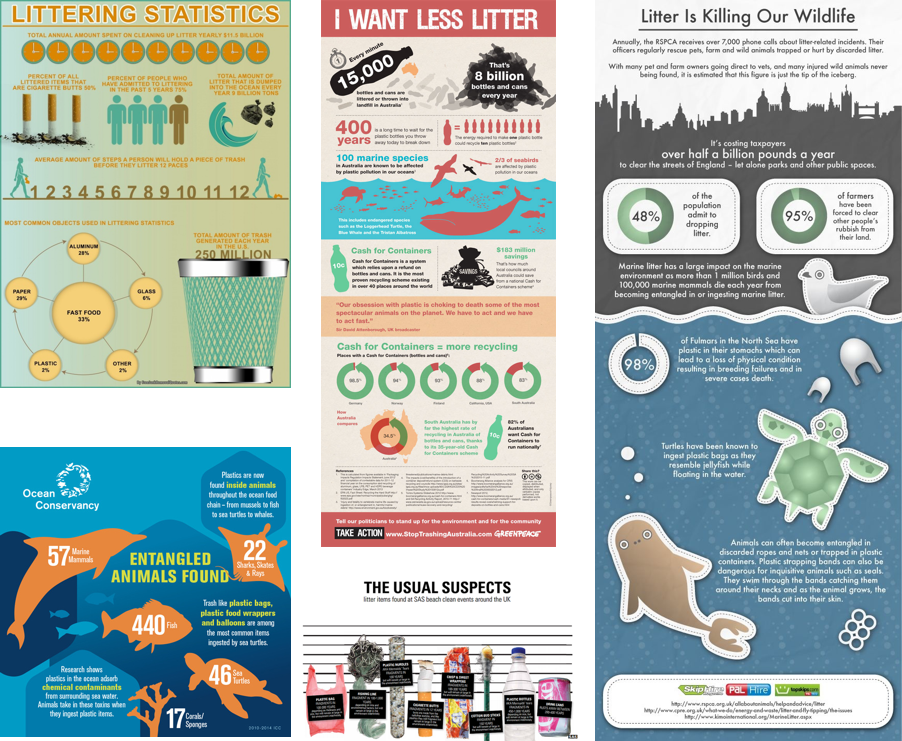
Inspecting Infographics
The students were presented with a variety of infographics about rubbish and waste management issues. They considered which examples helped the viewer to make sense of the data, and which representations did not give a clear message.
In particular, the image of the three cigarettes did alert the viewer that the information was about cigarette butts, but the 3 cigarettes had no clear relationship to the statistic, "50%". 3 out of 4 people related well to the "75%" of people who admitted to littering in the past 5 years, but the 10 clocks do not clearly link to "$11.5 billion". It was also decided that "9 billion tonnes" might be more clearly shown using 9 garbage bags instead of 3. It was agreed that the person walking along the number line was an effective way to demonstrate the fact linked to that image.
Students found one "good" example and one "poor" example of data illustration and shared their thinking with a small group, and then the class.
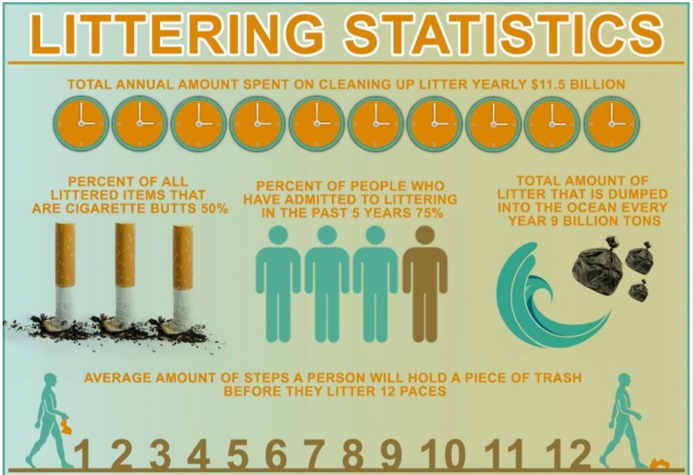
Clipped from Littering Statistics infographic via http://topinfographic.com/eye-opening-statistics-on-littering-infographic/
Showing data in different ways
Students used data from the 2015 Rubbish Report from the Clean Up Australia Day organisation to explore different ways of displaying data. They looked at different ways that data was presented within the report: in written form, in tables, using charts, and discussed what made this data easy to understand (or not).
Students used data from the 2015 Rubbish Report from the Clean Up Australia Day organisation to explore different ways of displaying data. They looked at different ways that data was presented within the report: in written form, in tables, using charts, and discussed what made this data easy to understand (or not).
Your task is to look at the data provided in the 2015 Rubbish Report from Clean Up Australia Day in Queensland and select some data that you think tells an important story. |
|
Litterbugs
One of the most common student questions is "Why do people litter?". At first glance, it seems to be a challenging question to answer using data, but in fact, this question can allow for some interesting data collection activities.
The Clean Up Australia Day organisation provides a unit plan called "The Litterbug" that has some good ideas around this challenge, including a description of some different types of "litterbugs".
Types of Litterbugs: |

|
Examining the different "types of litterbugs" led to purposeful discussion about how students could collect data to determine if those who litter within the school fall into particular categories.
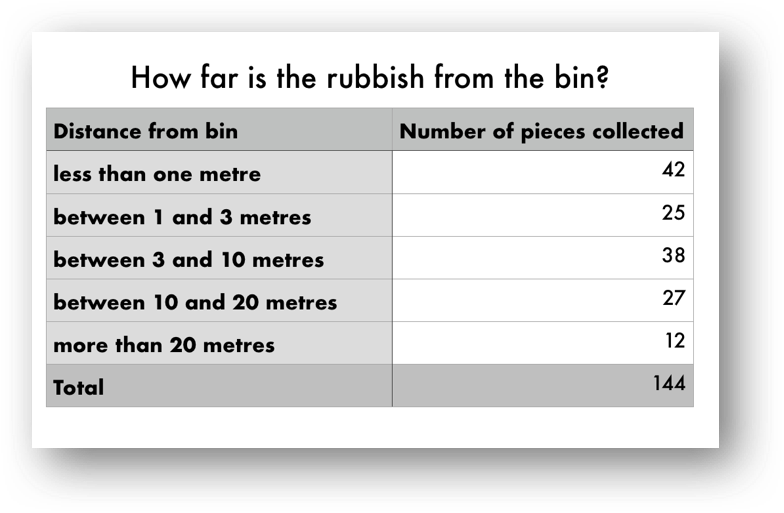
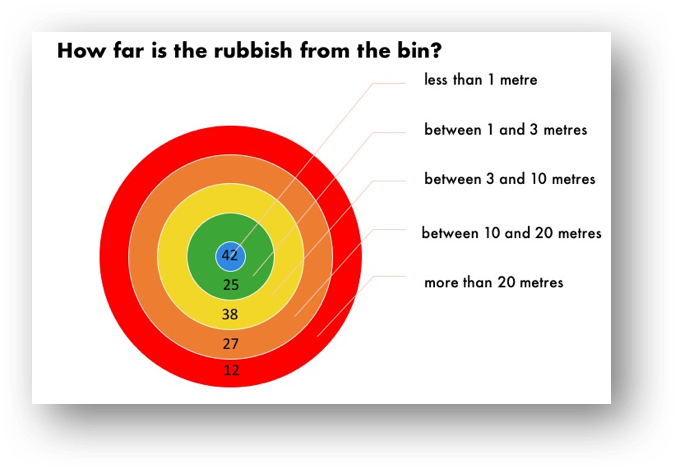
How far is the litter from the bin?
An interesting data collection activity was measuring the distance from pieces of litter found around the school from the nearest bin. Students were put into groups of three and given a particular measurement tool, depending on the expected distances to be measured, i.e., students who were asked to collect data in areas very close to bins might use a 30cm ruler or a tape, students who measured from the eating area to the bin might use a metre ruler, and students assigned to collect data in the play areas used a trundle wheel. In the groups, one student recorded the data (using a table or other student-devised method), one student measured the distance and the third student stood as a marker on the spot where the rubbish was and then placed the litter in the bin after the measuring was done.
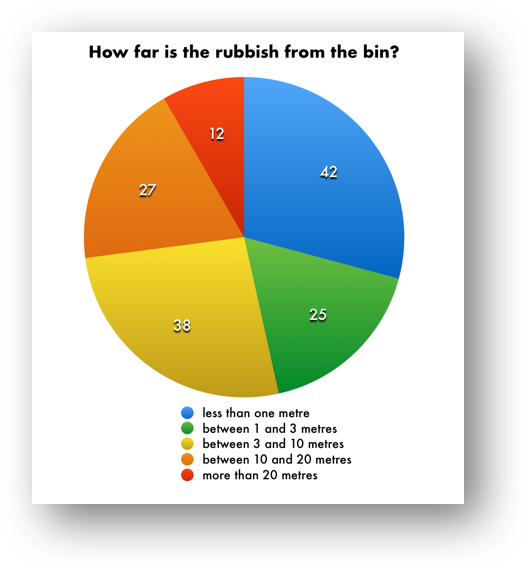
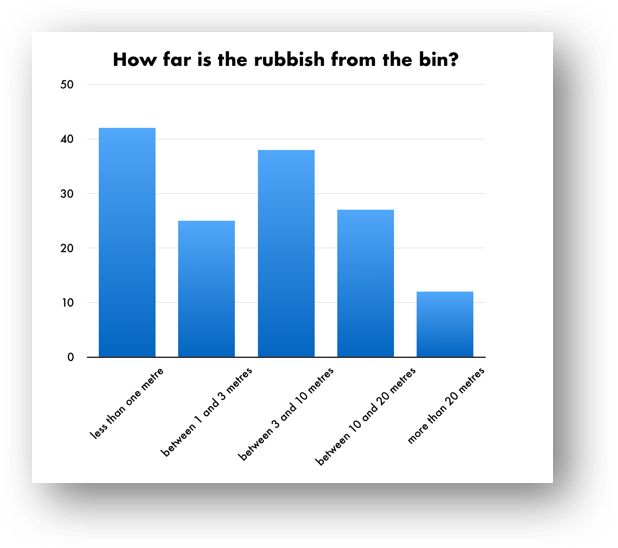
The data from all groups was combined to determine if there were patterns and collated onto a chart to show number of pieces vs distance from bin.
Through demonstration and instruction, the students were shown how the same data could be shown in different ways.
The data showed that a lot of litter in the school was found in close proximity to the bin, so the students could draw a conclusion that the issue was not a lack of bins, but that the people dropping the litter may have been "90%ing", "Foul shooting", or "Flagrant Flinging" litterbugs.
How far is the litter from the bin?
An interesting data collection activity was measuring the distance from pieces of litter found around the school from the nearest bin. Students were put into groups of three and given a particular measurement tool, depending on the expected distances to be measured, i.e., students who were asked to collect data in areas very close to bins might use a 30cm ruler or a tape, students who measured from the eating area to the bin might use a metre ruler, and students assigned to collect data in the play areas used a trundle wheel. In the groups, one student recorded the data (using a table or other student-devised method), one student measured the distance and the third student stood as a marker on the spot where the rubbish was and then placed the litter in the bin after the measuring was done.
The data from all groups was combined to determine if there were patterns and collated onto a chart to show number of pieces vs distance from bin.
Through demonstration and instruction, the students were shown how the same data could be shown in different ways.
The data showed that a lot of litter in the school was found in close proximity to the bin, so the students could draw a conclusion that the issue was not a lack of bins, but that the people dropping the litter may have been "90%ing", "Foul shooting", or "Flagrant Flinging" litterbugs.
|
|
Student Investigations
Using the questions that were brainstormed earlier, and other questions that have arisen through Geography studies. They collected data that would help them to answer their questions. Some students created surveys to find out reasons why people littered. Others collected and counted litter of different types and tracked changes over different days of the week. Some students made tallies of litter in different places around the school to identify "hot spots". Other students observed areas around eating spaces and bins during eating time.
The students presented the data they collected in different ways (table, chart, infographic) and combined their efforts into a presentation using Explain Everything.
