Glyphs |

|
|
Data concept:
Band:
Suggested year level:
Relevant content description:
|
Collecting, managing and analysing data
F-2
Year 2
|
Glyphs are a fun and colourful way for students to collect, explore and sort data about themselves and their classmates using a range of themes. A glyph is a pictorial representation of data, and can be created using drawings, collage or digital artworks. They can be used to tie in with a seasonal theme (such as Easter or Christmas) or a topic from another subject.
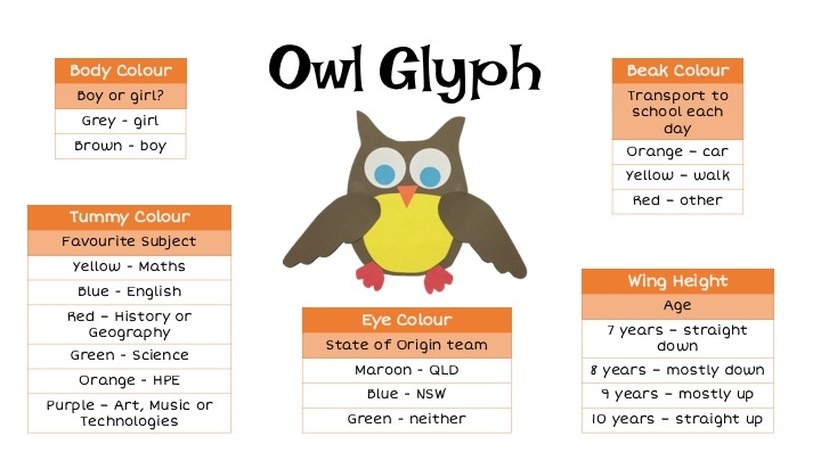
Owl Glyph
The owl glyph was created using paper collage. I prepared a number of cardboard templates for students to trace around so they could cut out the pieces they needed in the correct colours. This saves having to preempt the number of each piece you need in a certain colour, and was a fun way for the students to take more ownership over their glyph than if they had cut out photocopied shapes. (I do own circle cutters in two different sizes which made cutting out the eyes much faster and more accurate.)
The students use the information in the tables to determine the colours they need to build their owl. Once the paper owls are complete, they can be displayed on the wall in the classroom.
The students can revisit the data display to collect data about the class on different topics. Data can be collected using tally marks in a table and then used to make simple bar graphs or picture graphs about ways that students travel to school, or favourite subjects. Data can be sorted using more than one attribute to answer more complex questions such as "How many boys in our class are 8-years-old?". The class data can be analysed to see if there are patterns, e.g. "Do more girls like particular subjects than boys?" or to challenge stereotypes, e.g. "Do only boys play soccer?".
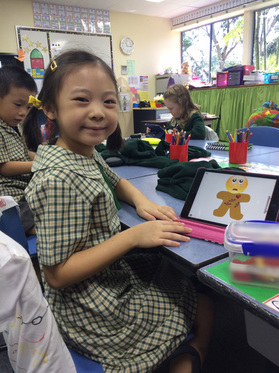
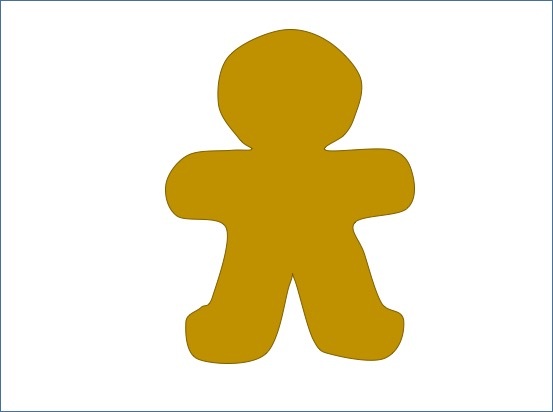
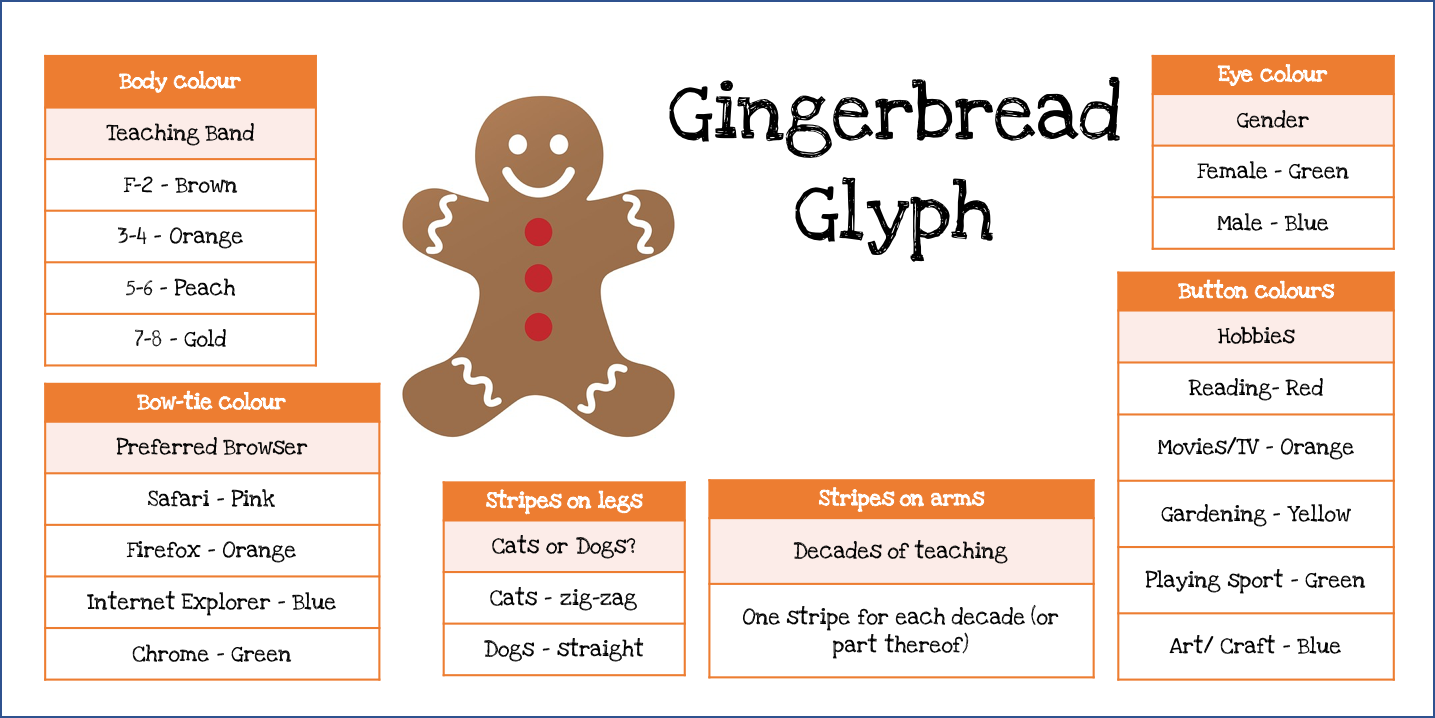
Gingerbread Glyph
This gingerbread glyph (from Sunny Days in Second Grade) was adapted to be completed by students on the iPads using Drawing Pad. Students copied the gingerbread shape I created into their camera roll and used the information from the table to determine the decorations required for their gingerbread shape. Completing the glyph on the iPads was fun, but it was more difficult to share the results for follow-up data collection activities. To get around this, students could print their creations if they had access to a colour printer, or they could email their images to the teacher who could then display the class set on a webpage or PowerPoint slide.
This gingerbread glyph (from Sunny Days in Second Grade) was adapted to be completed by students on the iPads using Drawing Pad. Students copied the gingerbread shape I created into their camera roll and used the information from the table to determine the decorations required for their gingerbread shape. Completing the glyph on the iPads was fun, but it was more difficult to share the results for follow-up data collection activities. To get around this, students could print their creations if they had access to a colour printer, or they could email their images to the teacher who could then display the class set on a webpage or PowerPoint slide.
|
|
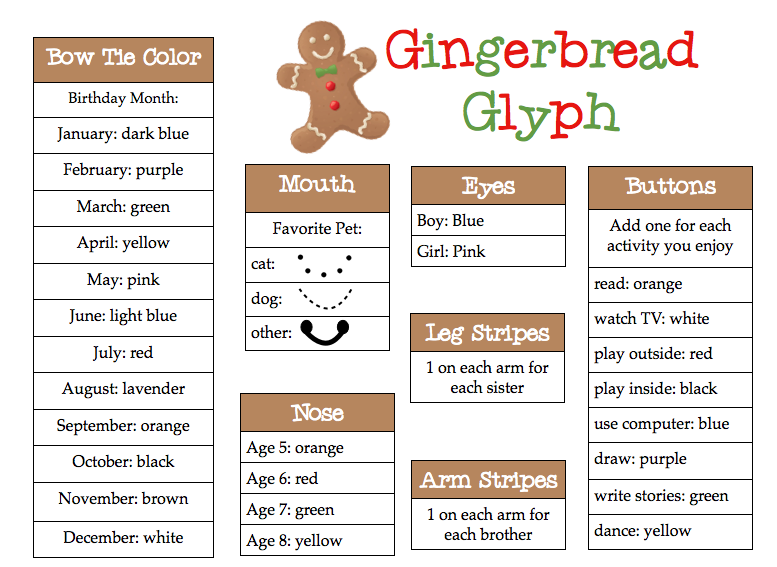
Gingerbread Glyph by Denise at Sunny Days in Second Grade
More glyph ideas
Glyphs can be created on any theme. There are many more ideas for using glyphs in the classroom on Mathwire and on Pinterest
Glyphs can be created on any theme. There are many more ideas for using glyphs in the classroom on Mathwire and on Pinterest
Beyond creating the glyphs...
- Students could create tables to collect data using tallies
- Use a simple, prepared spreadsheet to collect data and represent in graphs
- If glyphs are in a wall display, each day or week, reorganise the glyphs to sort on different attributes. Students can determine how they are organised.
- Students could design their own glyphs
